The portal has three main components: the ranch (single story) experiments, the colonial (two story) experiments, and the exposed electrical cord and cable experiments. Within in each section, where applicable, you will be able to explore the data, pictures, and video from each experiment. Below you will find examples of how to interact with results from each set of experiments. To enter any of the experimental series, click on the Learn More button below the description of the series you wish to explore.
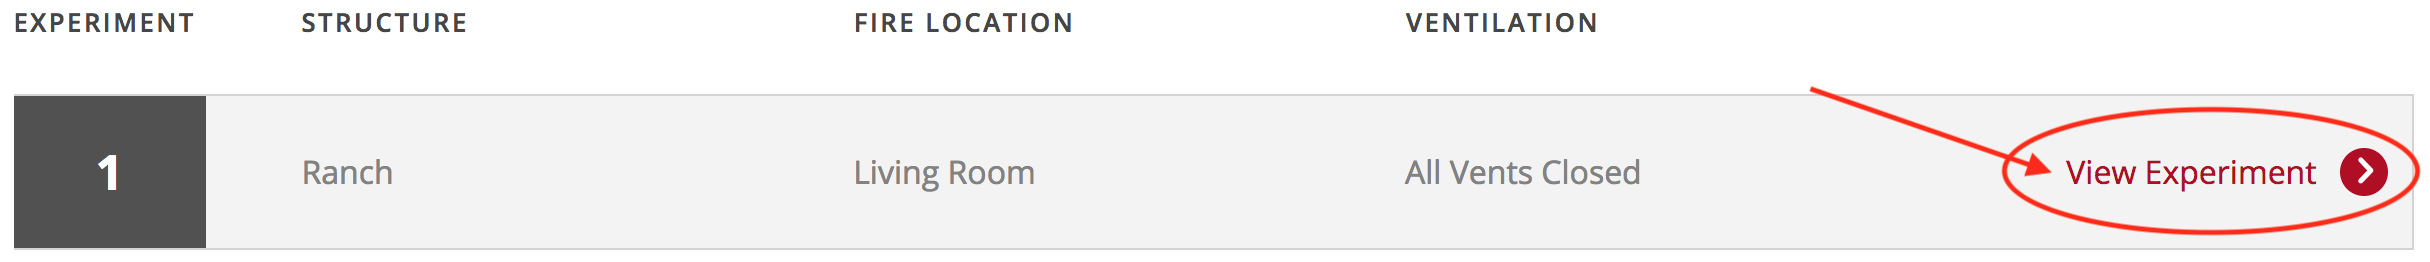
On the main ranch and colonial experiment pages, there is a table that lists each of the 13 experiments conducted in ranch and each of the 8 experiments conducted in the colonial. The rows describe the location of the fire and the ventilation conditions. To view the data of a particular experiment, click on the view experiment icon.
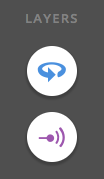
The landing page for each experiment has several key features: a floor plan with location of instruments and 360° photographs, a description of the experiment, a timeline of major events during the experiment, and a compilation video of the experiment from interior and exterior camera views. To simplify the floor plans while exploring the experiment, particular data layers can be turned on or turned off. In the image below, the two icons represent the 360° photos and sensors, respectively. Clicking either one of those icons, will turn on/off that specific layer on the floor plan. NOTE: For the colonial experiments, a second set of icons appear below the layer options to be able to toggle views between floor 1 or floor 2.
For each floor plan, the instrumentation icons are located at the positions within the structure at which they were installed during the experiments. The icons: orange cross for pressure, black square for gas velocity, green circle for oxygen concentration, and red triangle for thermocouple temperature are all clickable. Clicking the icon will pop-up the time-history data at that particular location. See the image below of an example sensor data plot popup.
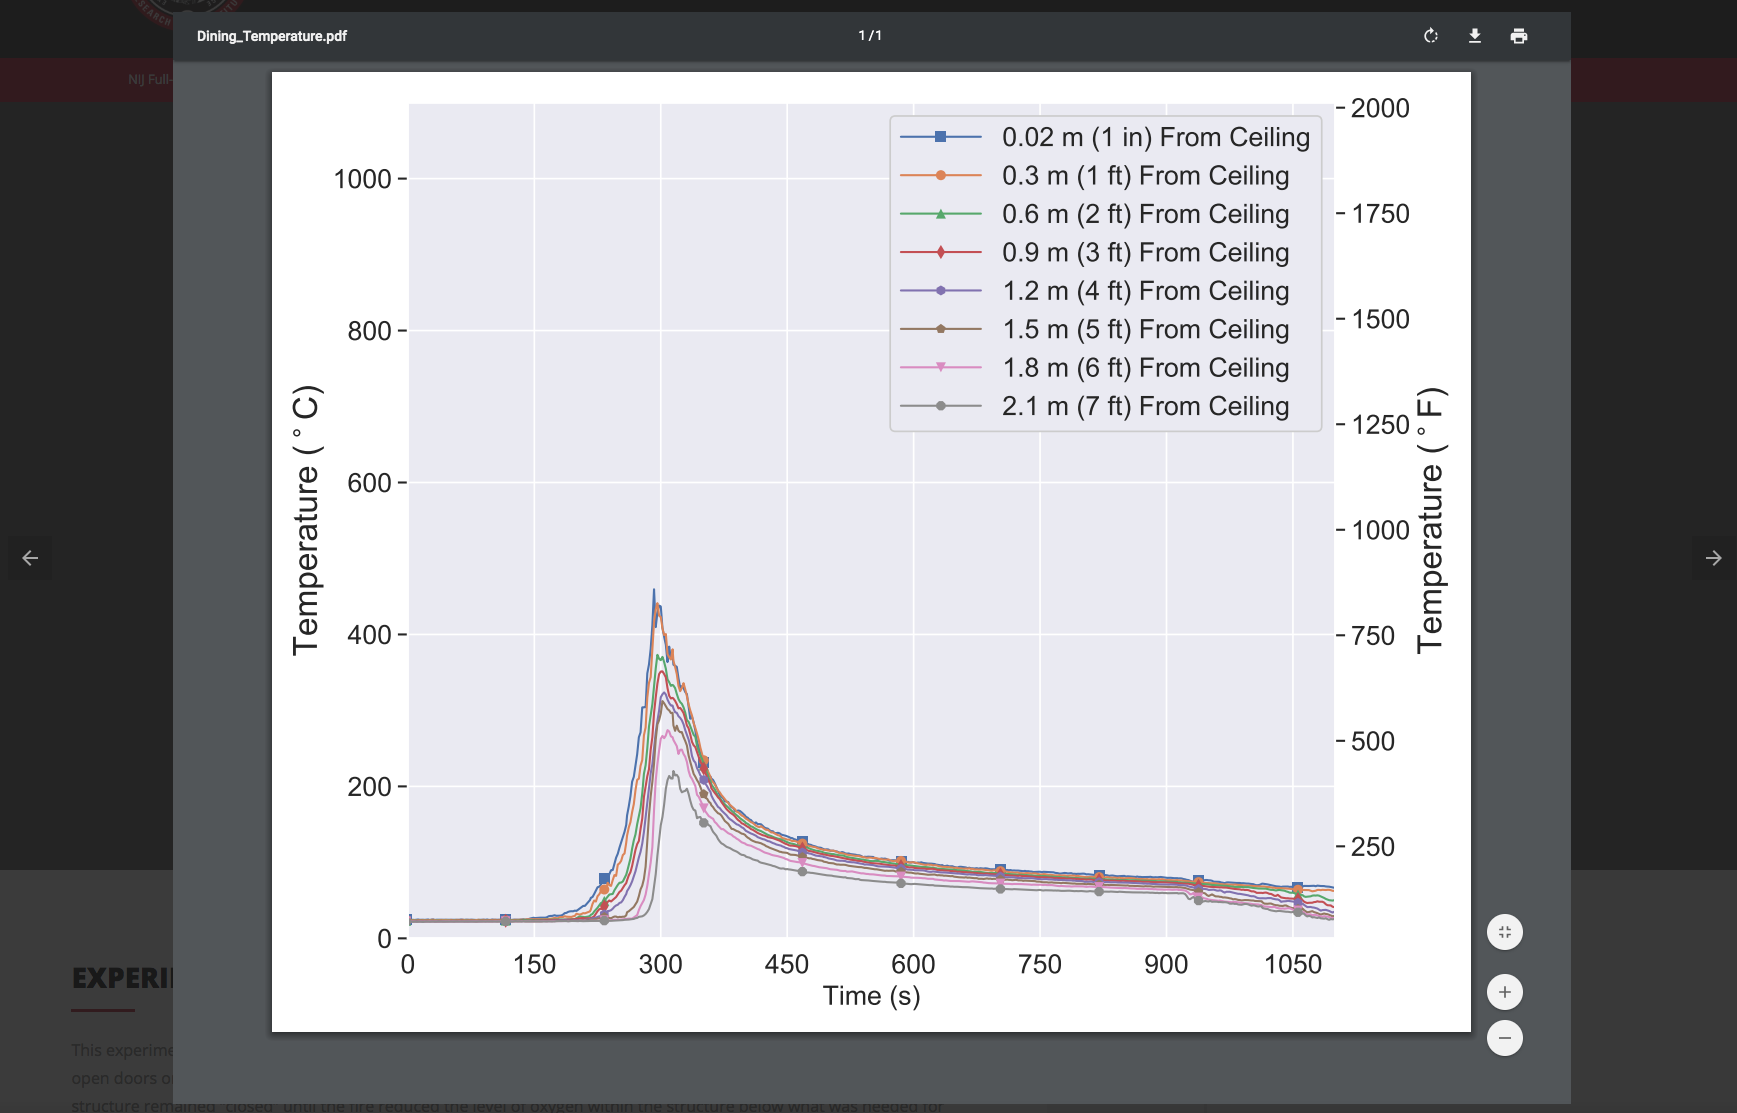
Once an chart is popped up, the arrows to the right or left of the popup can be used to cycle to other instrument locations within the structure. The popup can be closed by either clicking off the popup window or by clicking the X in the upper right hand corner. The open square, will make the chart full-screen.
To interact with the photographs, click on the 360° view icon. Similar to data from the sensors, the 360° will popup on the screen. Navigation within the image can be done in two different fashions:
Similar to the data interactions, there are left and right arrows that appear offset from the active 360° image. In the case of the photographs, the arrows only appear when there are multiple images at that particular location. If active, the arrows allow for the user to cycle to multiple images at the same location, but at different points in time. The default image is post suppression. For several experiments, there are pre-test images and stages of post-overhaul images. Below is an example of navigating through different stages of 360° images as well as rotating and zooming.
Similar to the full-scale structural experiments, the rows in the exposed electrical cord and cable experiments each correspond to a specific experiment. The rows describe the fuel load, peak heat release rate, and the total energy released prior to first circuit trip for each experiment. Like the full-scale experiment tables, clicking the View Experiment link on the row of interest will load the selected experiment results page. Here, the specific experiment pages differ from the full-scale experiments. Each row of table is clickable as indicated by the row being highlighted in red when hovered over. The image below shows an example table.
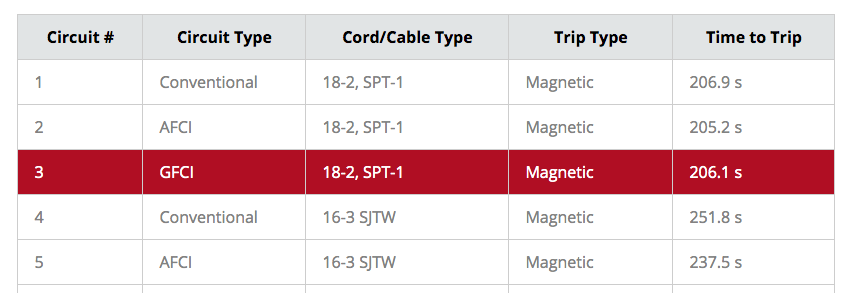
The table, which has 18 rows, provides information about the configuration about the particular cord of interest including the circuit type, cord/cable type, trip type, and time from ignition when the circuit tripped. When the row is clicked, the time-history electrical signal chart pops up which shows voltage, current, and differential current surrounding the trip. The arrows to the right and left of the chart pop-up will cycle through each of the test configurations.